[Note this is a posting in progress as I am adding more analysis]
I’ve a special place in my big heart for Reflections at Keppel Bay. Across all 721.5 km2 of Singapore, seaviews are scarce, much less with residences fronting them. In a country where the highest peak (all of 168m) is a larger-than-average rounding error for some mountainous ranges, finding residences with unique topographical features is no cakewalk. So here I am, looking backwards with mild fondness, at Reflections – one of the few properties at the top of our wish-list when we were searching for our second residence back in the earlier half of the last decade. 99-year leasehold aside, that marina view was stuff of dreams – as a canvas to how we imagined spending our evenings. Tenure-wise, all 3 projects along Keppel Bay are leasehold, and developed by Keppel Land, with Caribbean being the first, followed by Reflections and more recently, Corals (all suffixed with – “at Keppel Bay”). All 3 developments have 99-year leaseholds commencing from 1999, 2006 and 2007 (a bit strange for Corals given that residents only received their keys in 2017).
Anyway, back to Reflections. I recently had some pockets of time at 6am to run through all the 3280+ transactions along these 3 properties at Keppel Bay, with transaction data up till January 2020, with a slight emphasis on Reflections given how it tugs at the heartstrings. TLDR, and I say this with the bias of hindsight – Reflections would have been a massive disappointment for the many who had purchase units there. The payoff of any property, if construed as an investment, is predominantly a play on market beta, i.e. function of vintage (timing), than it is an idiosyncratic one (I’m sure there are counter-examples, but these are likely exceptions rather than the rule). In Reflections’ case, the launch of the project, in the period of over-exuberance just before the GFC, coupled with numerous property cooling measures in the decade that followed, rendered it a tepid investment over the last 13 years.
First off, transaction counts across the 3 properties – nothing stands out here. Typical dynamics at work – a rash of purchases direct from the developer in the early years followed by transactions in the secondary market in the subsequent years.
So this is where timing comes in (and this is where luck usually makes a significant cameo) – Caribbean was launched in the doldrums of the early 2000s that saw a meaningful confluence of negative factors hitting the local property market. Off the top of my head I can think of more than a few – the lingering fallout of the Asian Financial Crisis in the late 1990s, the US TMT bubble bursting in 2001 (coupled with the repercussions of 9-11), SARS in 2003, then as a final nail in the coffin, a glut of HDB units in the market – a multiple whammy that saw prices depressed before increasing almost three-fold from 2006-07.
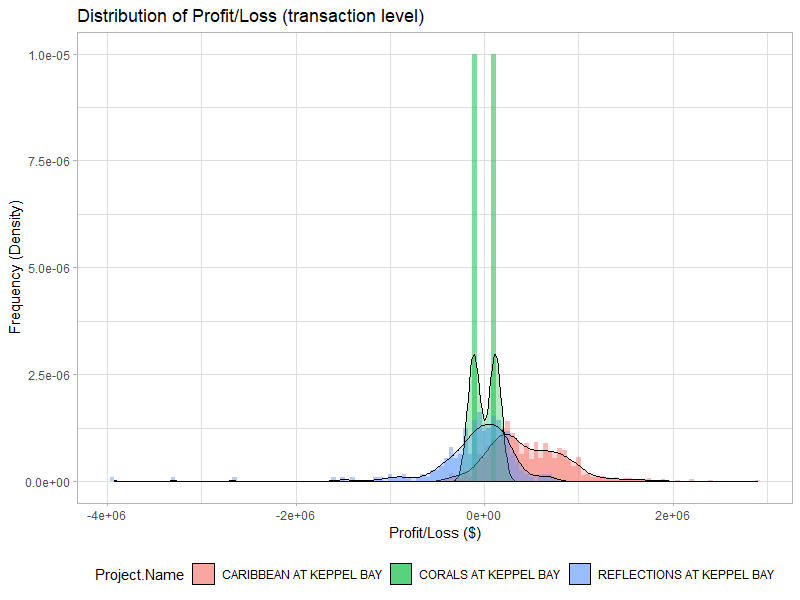
Here’s where the fun begins. For every unit that was sold in the secondary (resale) market, I matched it to the previous buy transaction – this paired transaction allows second order analysis of the the profit/loss of that specific unit. The resulting density distribution (as a proxy for a histogram) is clearly tri-furcated by project. Caribbean mostly reporting profits, Corals middling through (too early to tell, despite the high launch PSFs) and Reflections unanimously posting mostly losses.
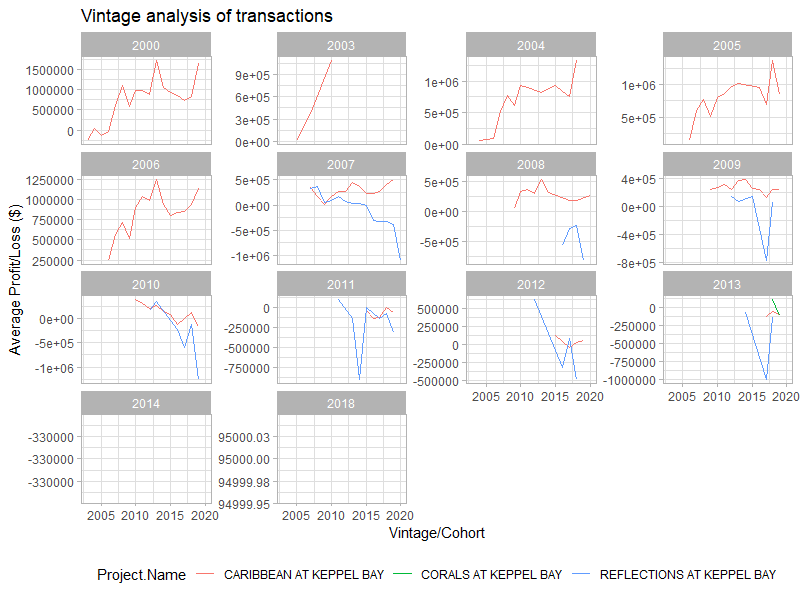
And things now get even funkier. For every transaction, I define a cohort in the form of the purchase “vintage”, i.e. the year in which the transaction was made. So, for a unit that transacted in 2005, the vintage is “2005” (like fine wine, there are the “good” years made possible by grape types matched with excellent weather, no insects/diseases, happy workers…). In a somewhat similar vein, as a budding property sommelier, you’d probably realize by now that that 2004-05 was a very fine vintage to have purchased ANY property in Singapore (this was a period where GCBs went for $3-400 psf so you could have picked up one for a “mere” $6m. Getting back on track to the analysis – so if this unit from the 2005 cohort then gets transacted again in 2014, I close off that unit from the class of 2005 by pairing it up with “2014”, and compute the profit/loss of that {unit, vintage year, transaction year} tuple.